
These are anxious times. Few people escape the unease born of a lingering suspicion: AI (artificial intelligence) will eventually destroy my job, and I will lose the means to earn a living. This is not an unfounded fear. For years now, the profession of translation has seen its work affected by machine-translation tools. In Spain, as I write this, a mass redundancy process (ERE) is being negotiated at a major company, Telefónica, where the firm argues that the use of AI allows it to dispense with thousands of jobs. But are we not, perhaps, facing one of those processes of creative destruction theorized by Schumpeter?
The magnitude of the change brought about by new technologies and AI may indeed give rise to doubt. Yet, even though the share of GDP devoted to labour compensation has been declining globally, economic growth has meant that the overall wage bill continues to increase, even in real terms.
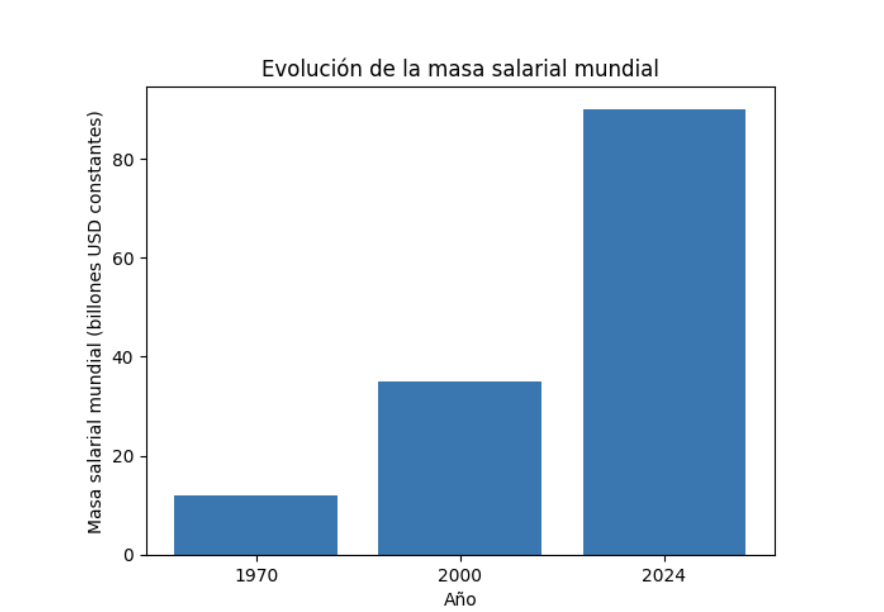
This image shows the growth of the global wage bill in constant USD (equivalent to 2011 USD). The calculation is based on approximate global GDP figures and on the decline in labour’s share of that GDP. Whereas in 1970 this share stood at over 60%, by 2000 it had fallen to around 58%, and by 2024 it is below 55%. Nevertheless, real economic growth means that, despite this decline in labour’s share, the total amount of money reaching workers today is far higher than it was 25 years ago (almost three times as much) and vastly higher than it was 55 years ago (the current real wage bill—adjusted for inflation—is 7.5 times that of 1970).
In other words, “creative destruction” appears to be working. The disappearance of business models, professions, and economic structures is not accompanied by an impoverishment of workers. This can be seen not only in the growth of the global wage bill, but also in its per capita distribution. That is, if we divide the wage bill by the total population, the resulting figure also shows a steady increase.

Global wages per capita stood at around USD 3,200 in 1970, about USD 5,700 in 2000, and roughly USD 11,100 in 2024. As can be seen, this figure also increases, although at a slower pace than the global wage bill as a whole. While the global wage bill in 2024 was almost three times its level in 2000, wages per capita have “only” doubled. Likewise, whereas the 2024 wage bill was 7.5 times that of 1970, wages per capita in 2024 are less than four times their 1970 level.
One might ask why we calculate wages per capita by dividing by the total population rather than by the number of workers alone. There are two reasons. First, global population figures are relatively easy to obtain and involve little uncertainty, whereas there is far more ambiguity in estimating the total number of workers worldwide. The second reason, however, is more important. It has to do with the fact that wages are the most important mechanism for the distribution of wealth across the world. Virtually the entire global population depends, directly or indirectly, on labour income. This includes not only workers themselves, but also other members of their households. Dividing by the total population therefore gives us an approximate picture of how this mechanism of wealth redistribution actually operates.
In any case, and for our purposes, the technological innovations introduced over recent decades, together with the phenomenon of globalization, have not damaged either the overall wage bill or wages per capita. From an economic perspective, we should begin to worry only when wages per capita stop growing and, above all, when the global wage bill begins to decline. As long as this does not happen, the system is functioning: what is destroyed is offset by what is created. But is this enough?
The answer is no, because aggregate wage data do not yet tell us how wages are distributed among workers. If we look only at average wages without considering which wages are most common, statistics can be misleading. It may appear that everyone is doing better, when in fact it is the growth of high wages that drives up the average, while more modest wages may stagnate or even fall.
To examine this issue, we can use an index (which we will call R), defined as the ratio of the average wage (total wage bill divided by the number of full-time workers) to the median wage, that is, the wage that separates the top 50% of earners from the bottom 50%. The higher R is, the greater the concentration of wage growth at the top; the closer R is to 1, the more evenly wages are distributed across workers. This indicator does not measure poverty, but rather how wage growth is distributed.
To analyse R, we will not focus on the global level. Instead, we will look at four countries—United States, France, Germany, and Spain—and examine how this indicator has evolved from the year 2000 to the present.
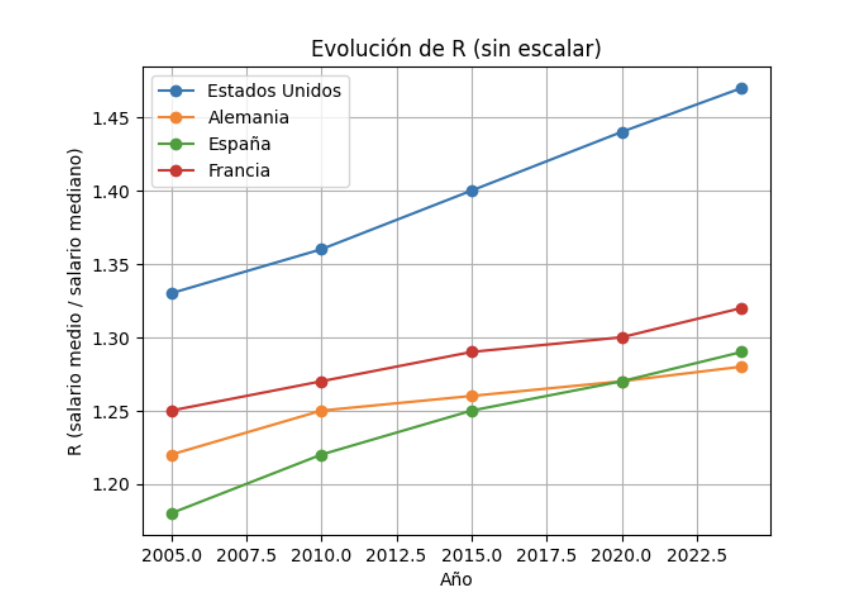
As can be seen, R increases in all the countries considered; that is, wage inequality rises everywhere. This is most pronounced in the United States—where inequality was already higher than in European countries—but it is also evident in the other three cases. In Spain, wage inequality ultimately surpasses that of Germany and comes close to that of France.
The increase in wage inequality does not in any way undermine the creative nature of the destruction described by Schumpeter. For the economy as a whole, the changes brought about by technological improvements and global integration do not entail a loss in the value of labour: its remuneration continues to grow both in absolute terms and in relative (per capita) terms. What these changes do imply, however, is a different distribution of wages. Those who earn the most earn increasingly more, while lower-paid jobs gradually fall into a worse—at least relative—position. From a purely economic perspective, this need not be negative. Lower-quality jobs must eventually be abandoned so that labour can concentrate in activities that generate greater wealth. The fact that destruction is creative does not mean it ceases to be destruction and, therefore, it may involve personal costs; but these costs may be necessary so that, as we have seen, not only the economy as a whole, but also workers’ remuneration (for workers as a group) continues to increase. A different question is whether this inequality has social or political consequences—but these must be examined from a perspective other than a purely economic one. Before turning to that issue, however, one further factor must be taken into account.
Rising wage inequality implies that there are winners and losers; but the latter will be less disadvantaged in contexts of economic growth. If growth is sufficiently strong, inequality will not be perceived as a loss, because even if individuals lose relative position in the wage hierarchy, in absolute terms the perception will still be one of improvement. To incorporate this idea into the previous graph, one could introduce a correction factor based on each country’s growth rate. We will call the resulting index CI, defined by the following formula:
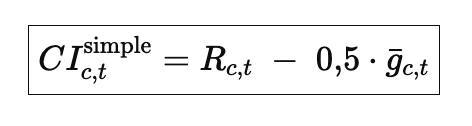
where c and t refer to the country and the year considered, and g to economic growth over the period in question (the preceding five years), adjusted by a parameter that allows us to assign greater or lesser weight to that growth. Using a correction factor of 0.5, the resulting values of CI for the countries considered are as follows:

Here we can see how economic growth alters the chart. As R (wage inequality) increases, the curve tends to move upwards; economic growth, by contrast, pushes it downwards. The outcome therefore differs from the previous chart because, for example, in the case of the United States, its strong growth means that although the R index (wage inequality) places it above all European countries (that is, in a worse position), once growth is taken into account it moves into a better position than they do. I developed this idea of linking inequality and growth in a post on this same blog a few months ago.
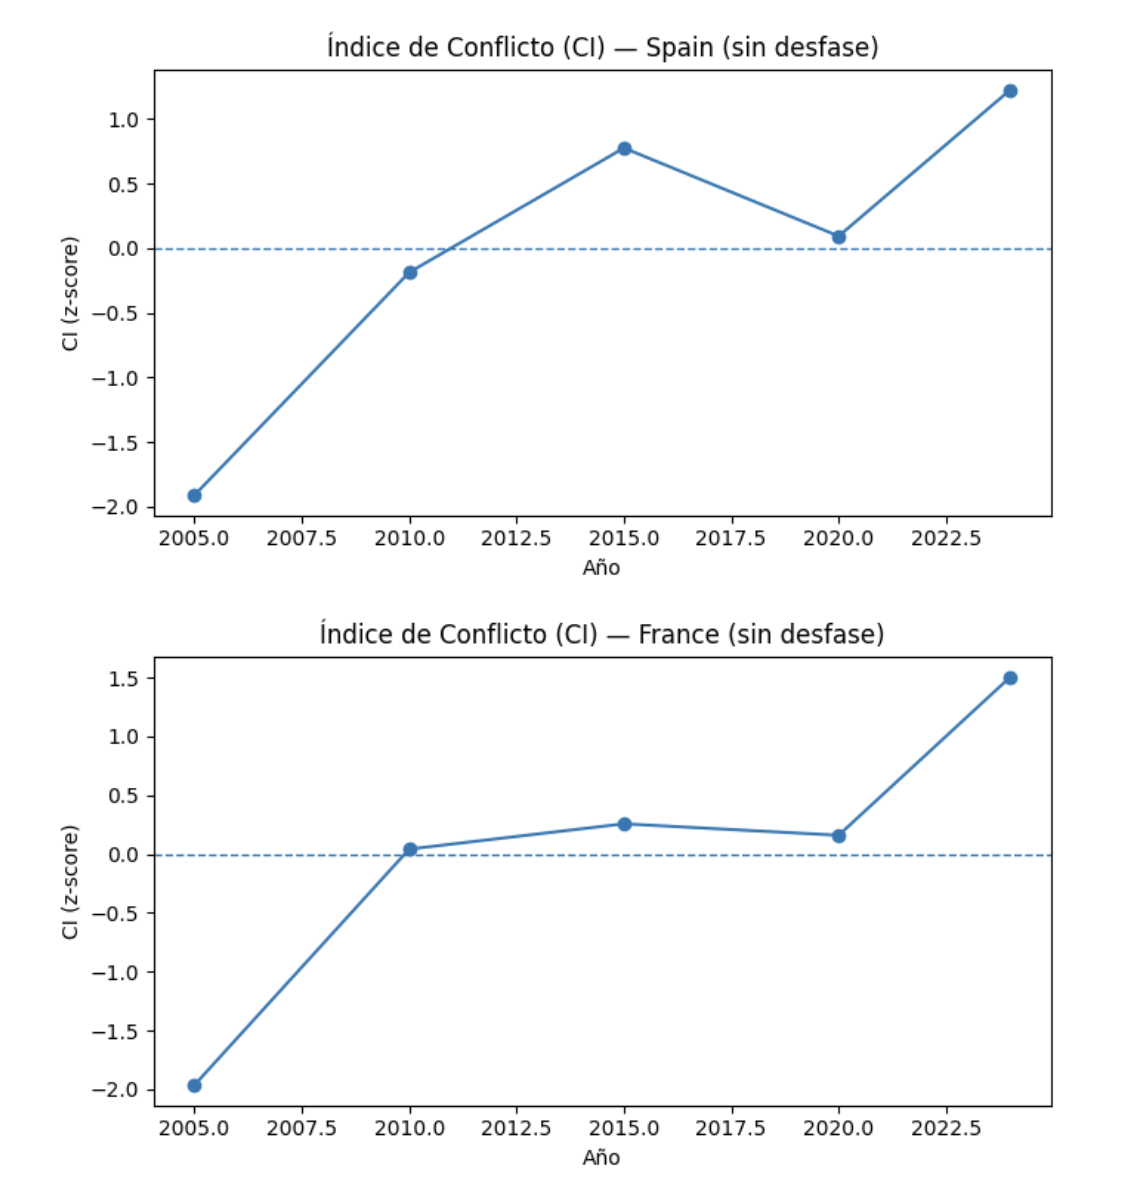
To go one step further, it is necessary to standardize the series by country. This is done using a tool known as the z-score, which replaces absolute index values with their deviation, in each case, from the historical mean of that economy. On this basis, the formula for the standardized CI index is as follows:

Where Z refers to the z-score of each variable. The resulting charts for each country, using this standardization, are as follows::

Standardization allows us to relate the evolution of the CI index to other indicators—specifically, the political polarization index available on the Our World in Data website (IPP). If we plot both standardized indices on the same chart, the country-specific results are as follows:
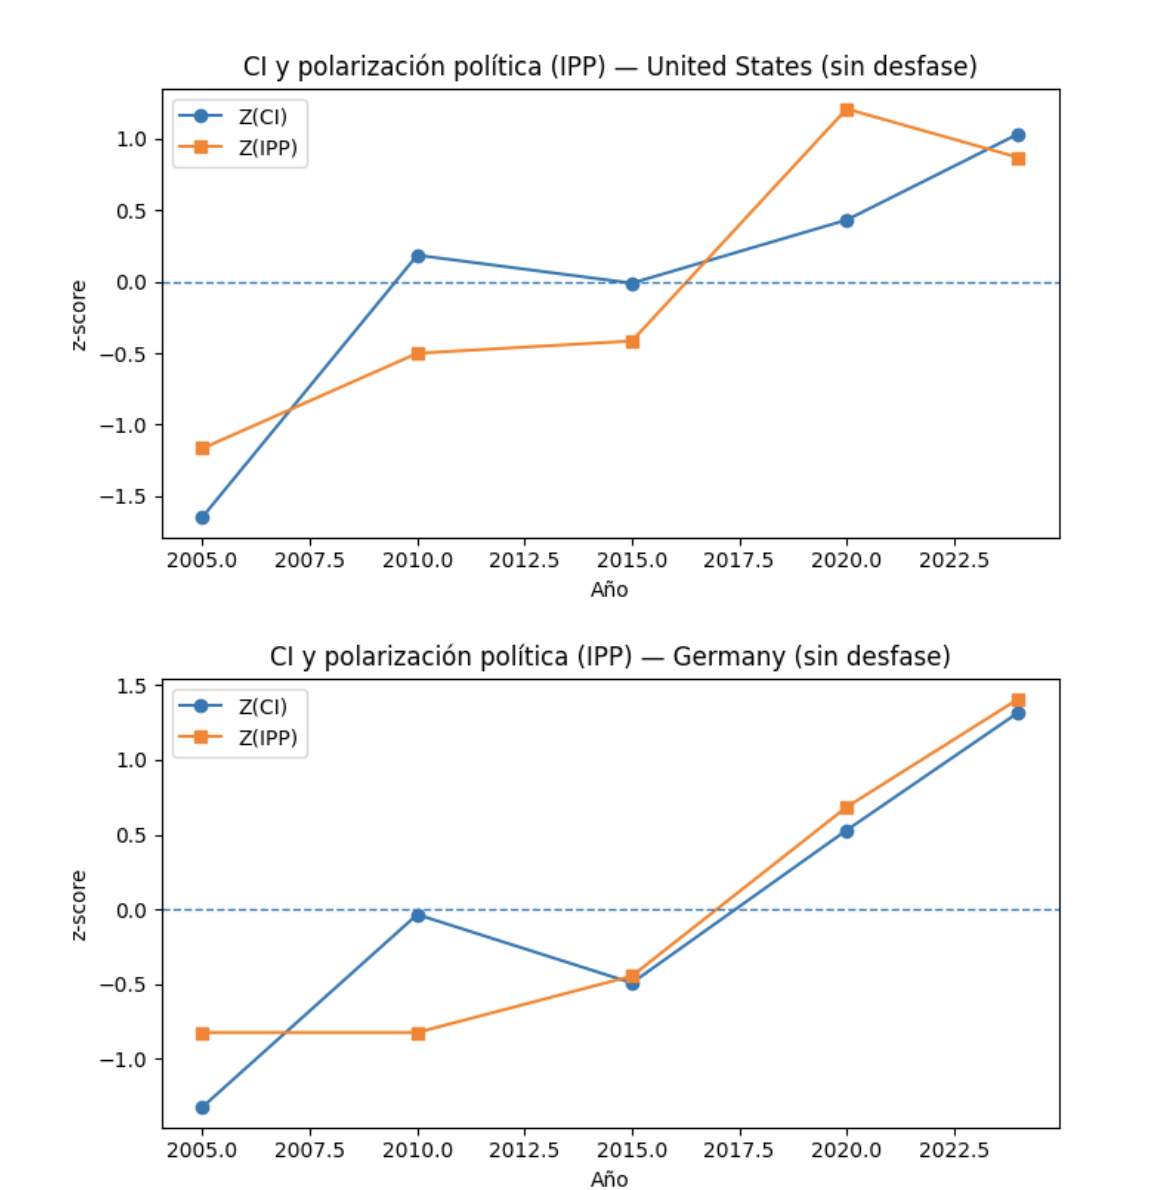
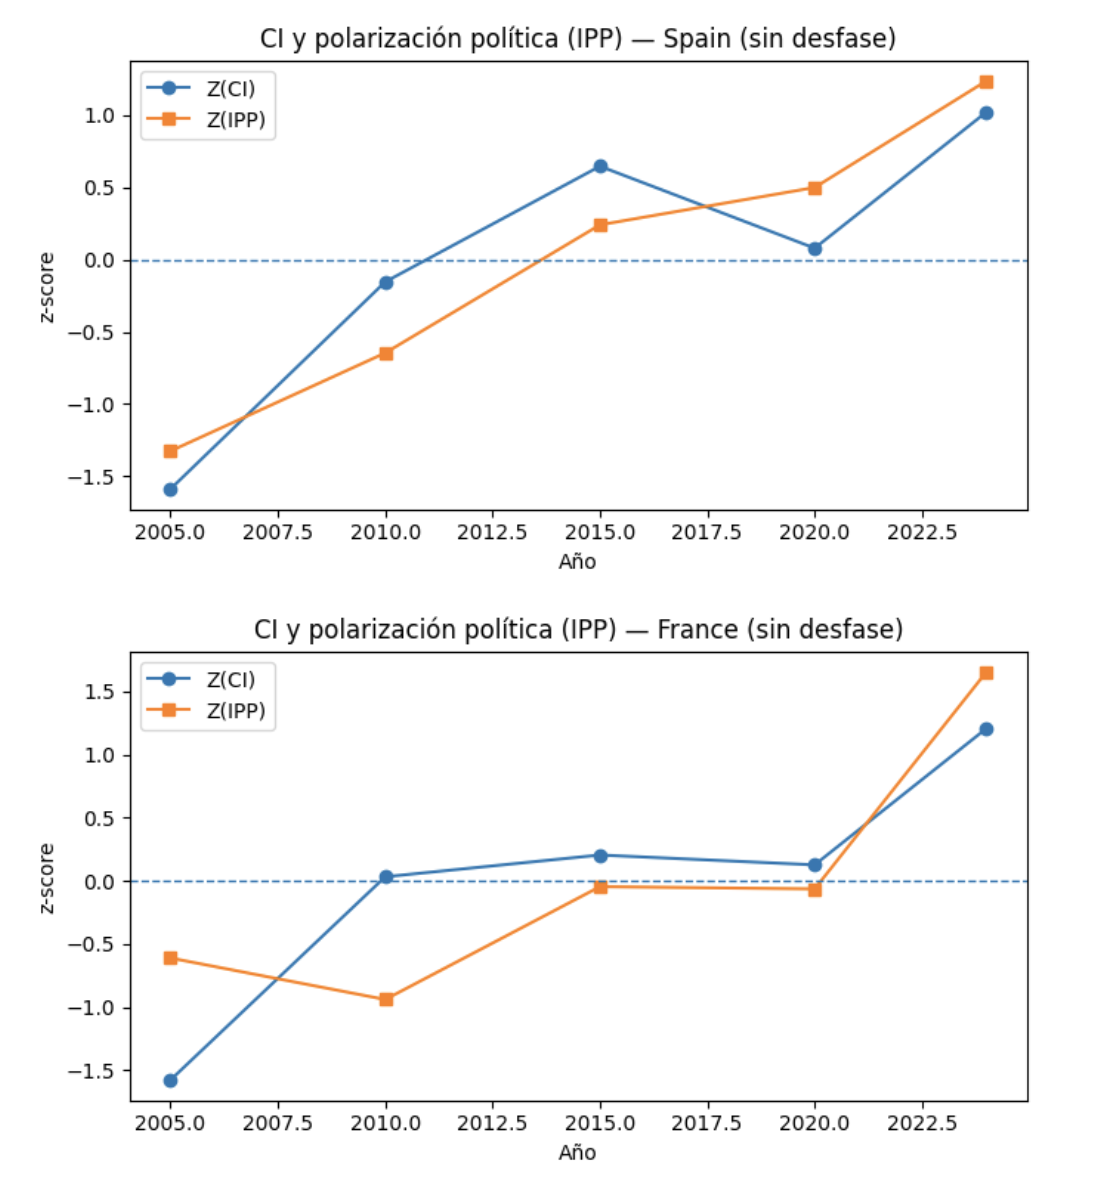
As can be seen, there is a clear correlation between the evolution of the CI index and political polarization. I noted earlier that, from a growth-centred economic perspective, the fact that “creative destruction” entails greater wage inequality is not necessarily a bad thing, since— as we have seen—both the overall wage bill and wages per capita continue to rise. In absolute and relative terms, therefore, “destruction” is beneficial for the labour market.
From a sociological or political perspective, however, the picture may be different. Inequality generates discontent which, when it is not offset by economic growth (hence the need to move from the R index to the CI index, which incorporates the growth factor), translates into political polarization: divisions deepen, opponents are stigmatized, and social tension increases. The previous charts show a correlation that cannot be ignored. As we can see, in all four countries considered, the CI index and the political polarization index follow a similar trajectory. In both Germany and France the correlation is almost perfect, except in 2010 (we will return to this shortly). In Spain the pattern is also similar, although polarization advances more rapidly than inequality, which may be attributed to factors that are not purely economic. Something similar occurs in the United States, where polarization has increased more rapidly than inequality in recent years—most likely reflecting the tensions surrounding the penultimate presidential election, including the storming of the Capitol.

It is also striking that in 2010 there is an increase in CI that is not accompanied by an equivalent rise in IPP. The most likely explanation for this divergence is that it coincides with the economic crisis of 2008–2010, a devastating shock that profoundly affected citizens. In Spain, measures were adopted that had previously been unthinkable (such as wage cuts for public-sector employees and the freezing of pensions), made possible by broad agreements among the major political forces (for example, the constitutional reform to guarantee debt repayment). This was a context in which discontent led to paralysis rather than confrontation. As is well known, in Spain and in other countries confrontation and polarization emerged somewhat later, whereas at the height of the crisis the immediate reaction was one of paralysis. This paralysis is reflected in the charts above, where we can see that in each country the rise of the blue line (CI) around 2010 is less pronounced than the movement of the orange line (IPP), with polarization even declining in France.
Based on what we have seen so far, it can be concluded that the technological changes of recent decades have not led to a decline in either the global wage bill or wages per capita. Creative destruction works.
What is happening, however, is a rise in wage inequality. Average wages increase because the remuneration of the highest-paid workers rises much faster than that of those at the bottom of the wage scale.
This inequality can be partially offset by economic growth; but even when growth is taken into account, we cannot ignore the correlation between rising inequality and increasing political polarization, which reflects growing tensions within society. Of course, inequality is not the only polarizing factor and, as we saw in 2010 (and as the charts confirm), in certain circumstances rising inequality can be more paralyzing than confrontational. Even so, it is difficult to dismiss the possibility that the growing polarization observed in the politics of many countries is, to some extent, related to rising wage inequalities, which appear to be a side effect of the “creative destruction” in which we have been immersed for decades.
This brings the post to a close. Its aim was to assess whether we are indeed witnessing a phase of creative destruction. The answer, in my view, must be affirmative as long as both the overall wage bill and wages per capita continue to grow. The inequalities that are being generated, however, may have consequences for society as a whole, as we have seen when considering the IPP. From this point on, the prescription is simple: if there is no growth, there must be equality; otherwise, social tensions may ultimately erupt—especially in contexts of declining institutional trust.
